What Is Amazon QuickSight?The Detailed Guide
What is Amazon QuickSight?
Amazon QuickSight is a business intelligence service built in the cloud under the Analytics section of AWS services. It enables organizations to make smarter data-driven decisions. The Amazon QuickSight BI utility enables businesses to create and analyze data visualizations for easier understanding and to help businesses in decision-making. These interactive dashboards can be seamlessly embedded into many applications and websites.
With Amazon QuickSight, you can develop easy-to-understand insights from data while allowing you to connect your data from the Cloud or Corporate on-premises servers and combine data from various sources. Data sources can include AWS data, third-party data, Big Data, Spreadsheet data, SaaS data, and B2B data. Once you have data you can build interactive dashboards pretty quickly and make your data look good. It is a fully managed Cloud-based service, provides enterprise-grade security, and high availability, and is highly scalable with no infrastructure to deploy or manage.
How To Create Amazon QuickSight Dashboard?
Connect to data
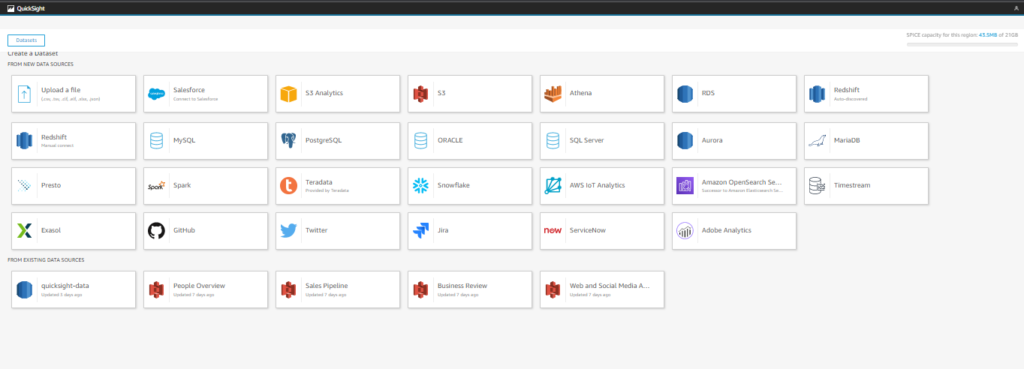
Amazon QuickSight can connect and pull/read data from many data sources regardless of location. Can connect databases in AWS cloud, corporate data center, SaaS, third-party applications, CSV/XLSX/JSON files, etc. Some of the Amazon services which can be integrated with QuickSight as data sources include RDS, Athena, Redshift, Simple Storage Service (S3), Elasticsearch Service, etc.

Collect and load data
Once Amazon QuickSight connects to data sources it loads the data into QuickSight. In this stage, QuickSight starts Data preparation before analysis. QuickSight prepares data by filtering it, renaming fields, changing data types (if required), and adding calculated fields. We can use custom SQL queries to load only data needed into QuickSight.
Analyze data
QuickSight examines the data, performs calculations, and creates graphs/tables of our preferred choice. We can opt to select Quicksight SPICE engine to perform calculations and create graphs quickly.
Create visualizations
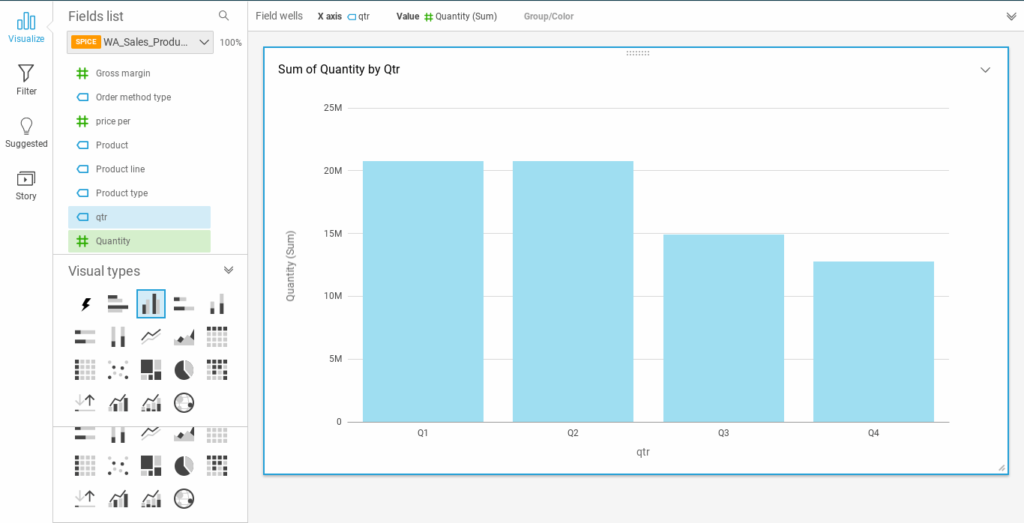
QuickSight creates visualizations users can arrange and customize. The tool shares interactive dashboards and email reports. The QuickSight workspace also provides interactive graphs, charts, tables, stories, sheets, and many other types of visuals. With embedded dashboards, users can view published dashboards within their enterprise applications.

Terminology Used in QuickSight
Data preparation is the process of transforming data for use in an analysis which includes making changes filtering out data, renaming fields, changing data types, adding calculated fields, and creating SQL queries to refine data.
SPICE (Super-fast, Parallel, In-memory Calculation Engine) is the in-memory engine that QuickSight uses. SPICE is used to perform advanced calculations and serve data rapidly.
Data analysis is the workspace for creating data visualizations, which are graphical representations of your data. Each analysis contains a collection of visualizations that you arrange and customize as per your requirements. Each Analysis can have multiple sheets.
A data visualization, also known as a visual, is a graphical representation of data. There are many types of visualizations, including diagrams, charts, graphs, and tables. All visuals begin in AutoGraph mode, Quicksight automatically selects the best type of visualization for the fields that you select. You can also take control and choose your own visuals.
Machine learning (ML) Insights propose narrative add-ons that are based on an evaluation of your data. You can choose one from the list, for example, forecasting or anomaly (outlier) detection. Or you can create your own. You can combine insight calculations, narrative text, colors, images, and conditions that you define.
A sheet is a page that displays a set of visualizations and insights. You can add more sheets, and make them work separately or together in your analysis.
Also Read: IOT Analytics: The Detailed Guide
Pros of Amazon QuickSight
A dashboard is the published version of the analysis. You can share with other users of Amazon QuickSight for reporting purposes. You specify who has access and what they can do with the dashboard.
- The SPICE engine has the advantage of fast responses when interacting with dashboards. Quicksight integration with data sources inside AWS or outside AWS is simple and easy to set up.
- The QuickSight interface that AWS provides is easy to learn and use. It makes it pretty simple for users to create some stunning visualizations. Quicksight is a highly scalable and fully managed service. You dont need to maintain a license and underlying infrastructure.
Cons of Amazon QuickSight
- QuickSight does have a variety of visualization types. However, some useful visualization types are notably missing. For example, candlestick graphs, Gantt charts, and high and low close charts.
- Your dashboards can be automated to refresh at a minimum of every hour for data stored in SPICE. If you have a need to create real-time dashboards and visualizations, it may be a concern.
- Quicksight is considered less powerful compared to other BI tools in the market.

AWS QuickSight Pricing
AWS QuickSight has two editions to differentiate pricing: Standard edition and Enterprise edition
- Standard Edition: This edition is for personal data analysis and exploration. It is available for US$9/month with an annual subscription or US$12 for monthly payments. SPICE capacity is 10GB/User, for extra capacity, it is $0.25 per/Month.
- Enterprise Edition: This edition is for large-scale use. It is available both for authors or dashboard publishers and readers. The pricing for readers is $0.30/session to a max of $5/month for a user. But the pricing in terms of readers’ session capacity is US$250/month for every 500 sessions. For authors, the pricing is $24/month and with an annual subscription, it is $18. SPICE capacity is 10GB/User, for extra capacity, it is $0.38 per/Month.
Conclusion
AWS QuickSight is a lightweight and easy-to-use BI tool. QuickSight is often preferable over other BI tools if the source of your data is from AWS and can easily be set up and also at a low cost. If data is stored elsewhere, the features should be weighed against the cost of each option. We hope this gives you some insights into AWS QuickSight.


